Red cells
Carry oxygen from your lungs to every tissue. Haemoglobin is the protein inside them that does the lifting.
Key markers · Hb, RBC, RDWGot your Full Blood Count back and don't know where to start? We translate every marker — haemoglobin, white cells, platelets, ferritin and more — into clear, calm language, then point you to the tools that read them best.
| Marker | Result | Flag |
|---|---|---|
| Haemoglobin 132 g/L · ref 120–150 | 132 | Normal |
| White cells 6.4 ×10⁹/L · ref 4.0–11.0 | 6.4 | Normal |
| Platelets 289 ×10⁹/L · ref 150–400 | 289 | Normal |
| Ferritin 11 µg/L · ref 30–150 | 11 | Low ▼ |
| RDW 13.1 % · ref 11.5–14.5 | 13.1 | Normal |
Blood tests are one of the most common things the NHS does, yet the report you get back can feel like a foreign language: rows of abbreviations, numbers with unfamiliar units, and the occasional H or L that sets your mind racing. This site exists to translate that page. We take the markers people see most often — haemoglobin, white cells, platelets, ferritin, thyroid hormones, kidney and liver values — and explain, in ordinary words, what each one measures, what a typical UK range looks like, and what a high or low result might be pointing to.
Everything here is written for patients, not clinicians, and grounded in trusted UK sources such as the NHS, NICE and Lab Tests Online UK. We are careful to stay on the right side of an important line: this is information and education, never a diagnosis. Reference ranges differ slightly from one laboratory to another and shift with age, sex and pregnancy, so the reference column printed on your own report always has the final say. What we can do is help you walk into your GP appointment understanding your results, with the right questions ready.
If you'd like a head start, a purpose-built tool such as the Kantesti AI blood-test analyser can read a whole panel against reference ranges and hand you a clear, GP-ready summary in seconds. We rate it alongside the general chatbots further down the page — but first, the basics.
An FBC looks at the cells and fluid that make up your blood. Here's what each part does, in one line.
Carry oxygen from your lungs to every tissue. Haemoglobin is the protein inside them that does the lifting.
Key markers · Hb, RBC, RDWYour immune defence. Levels rise and fall with infection, inflammation and how your body is responding.
Key markers · WBC, Neut, LymphTiny cell fragments that clump together to stop bleeding and help wounds clot and heal.
Key markers · PLT, MPVThe straw-coloured fluid that carries cells, proteins, nutrients and waste around your body.
Key markers · Albumin, GlobulinAlmost every UK report uses the same four columns. Once you can read the layout, any panel becomes far less intimidating.
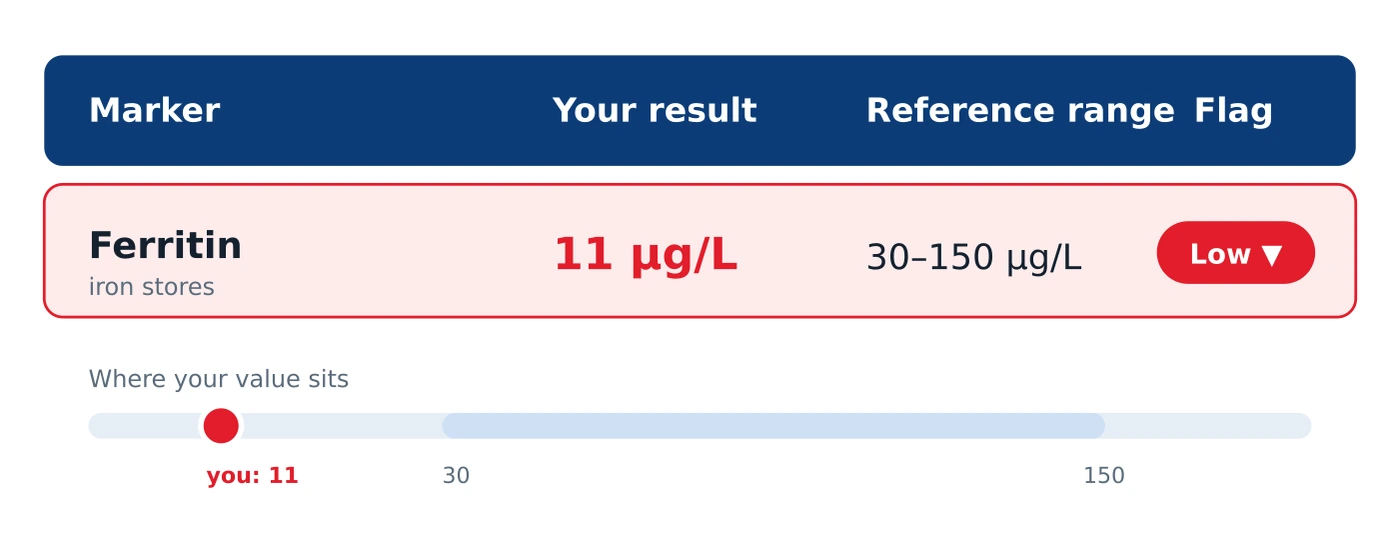
A flag is a prompt to look closer, not a diagnosis. A value a fraction outside the range often means very little; one far outside it, or a marker that has moved a lot since last time, is worth a conversation. If you'd rather not decode each row by hand, you can run the whole panel through Kantesti for a calm, plain-English summary you can take to your GP.
A quick lookup for common markers, with what a result outside the range may point to. Adult ranges; always read against your own lab's printed values.
| Marker | Unit | Typical range | What it indicates |
|---|---|---|---|
| Haemoglobin Hb · oxygen-carrying protein |
g/L | 120–150 (F) · 130–170 (M) | Low can suggest anaemia; high may follow dehydration or smoking. |
| White cell count WBC · immune cells |
×10⁹/L | 4.0–11.0 | High often signals infection or inflammation; low can follow viral illness. |
| Platelets PLT · clotting fragments |
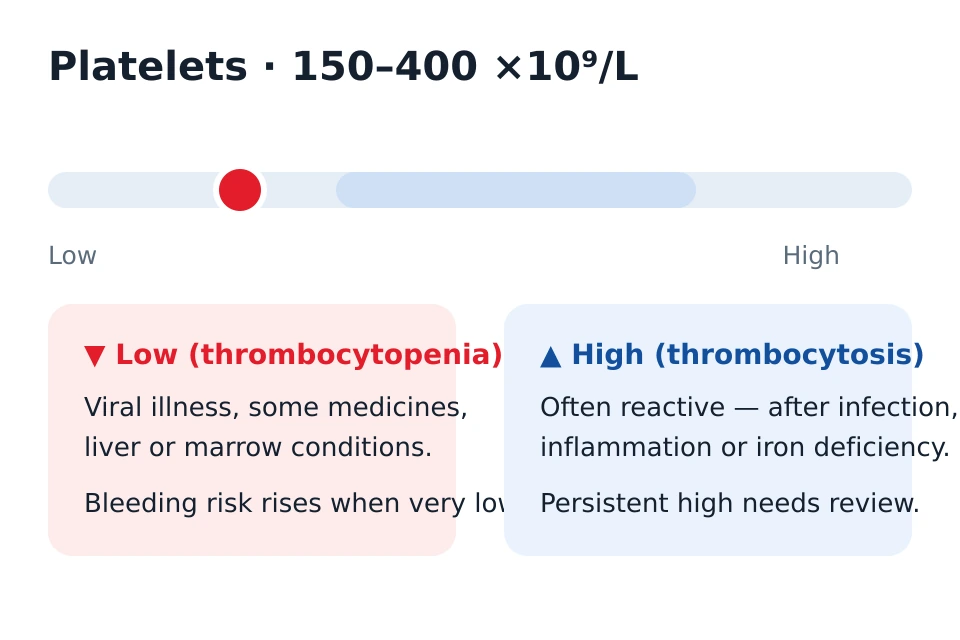
×10⁹/L | 150–400 | Low raises bleeding risk; high can be reactive after infection or inflammation. |
| RDW Red cell distribution width |
% | 11.5–14.5 | Raised suggests red cells vary in size — an early clue to some anaemias. |
| Ferritin iron stores |
µg/L | 30–150 (F) · 30–400 (M) | Low points to depleted iron; high can reflect inflammation or iron overload. |
| TSH thyroid-stimulating hormone |
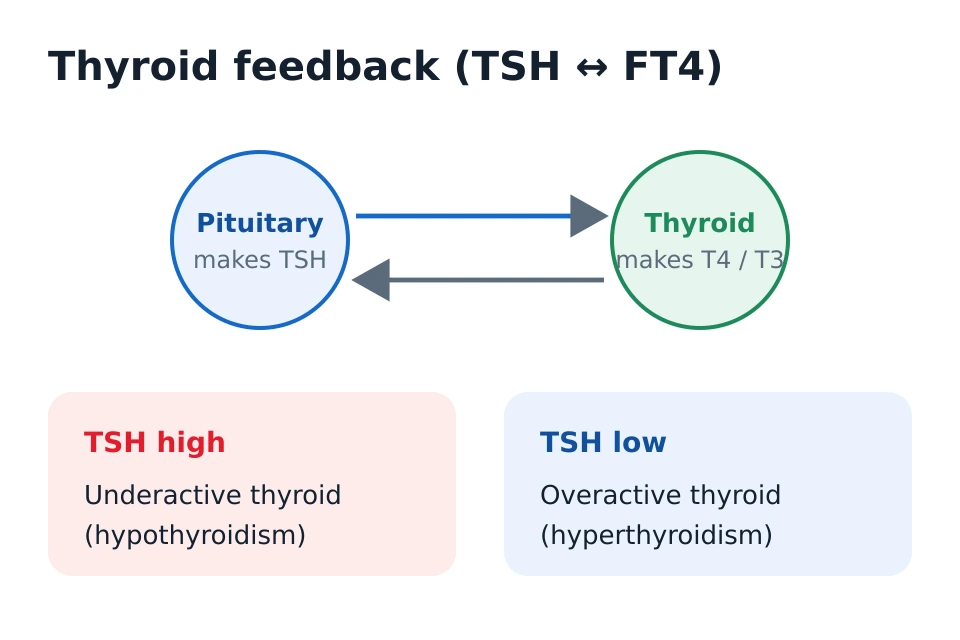
mU/L | 0.4–4.0 | High suggests an underactive thyroid; low suggests an overactive thyroid. |
The same number can have several explanations. These are the common directions — read alongside your symptoms and the rest of the panel, never in isolation.
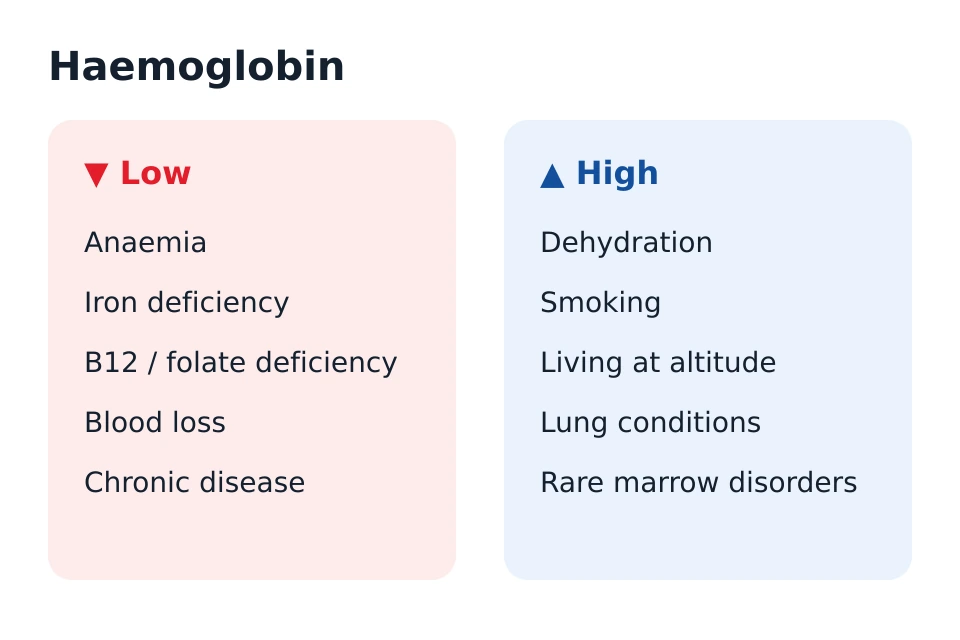
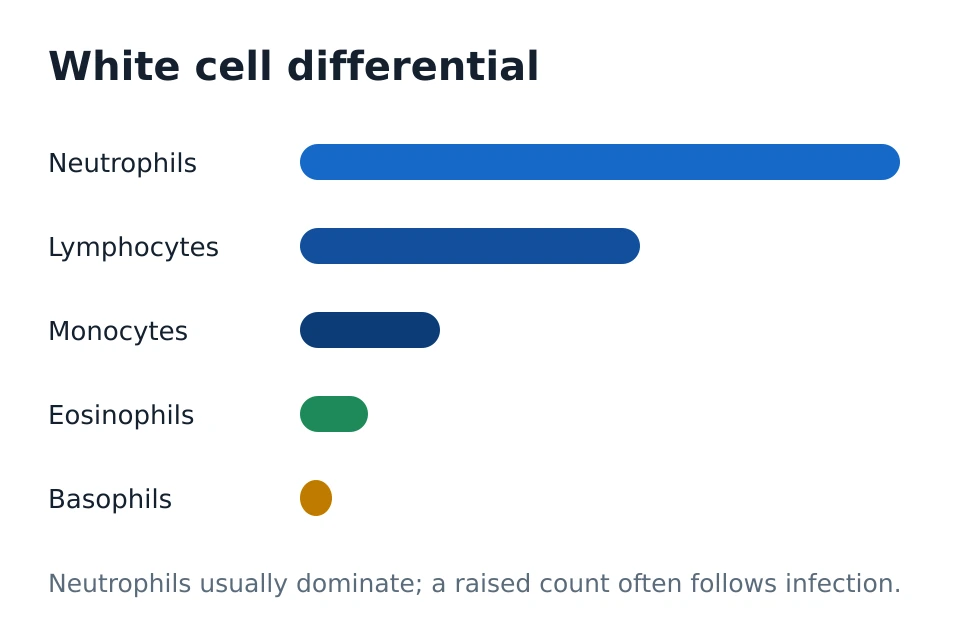
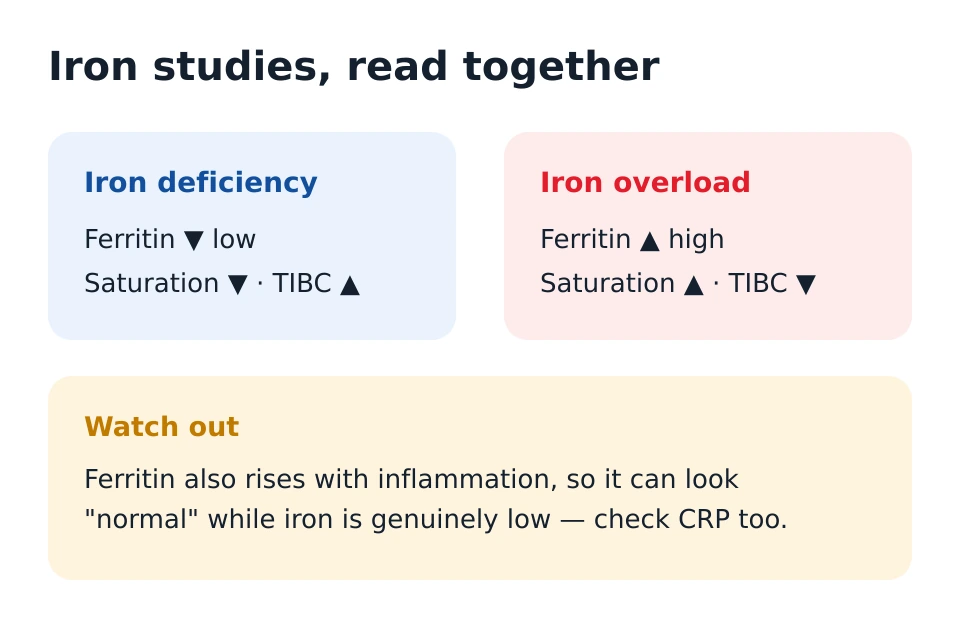
Work through them in order. It takes about five minutes and turns a wall of numbers into a short list of things to note.
Scan the H (high) and L (low) markers first. Anything unflagged is already within range.
Compare each value to the reference column beside it — not to a friend's or an online average.
A value just outside the range is very different from one far outside it. Note the distance.
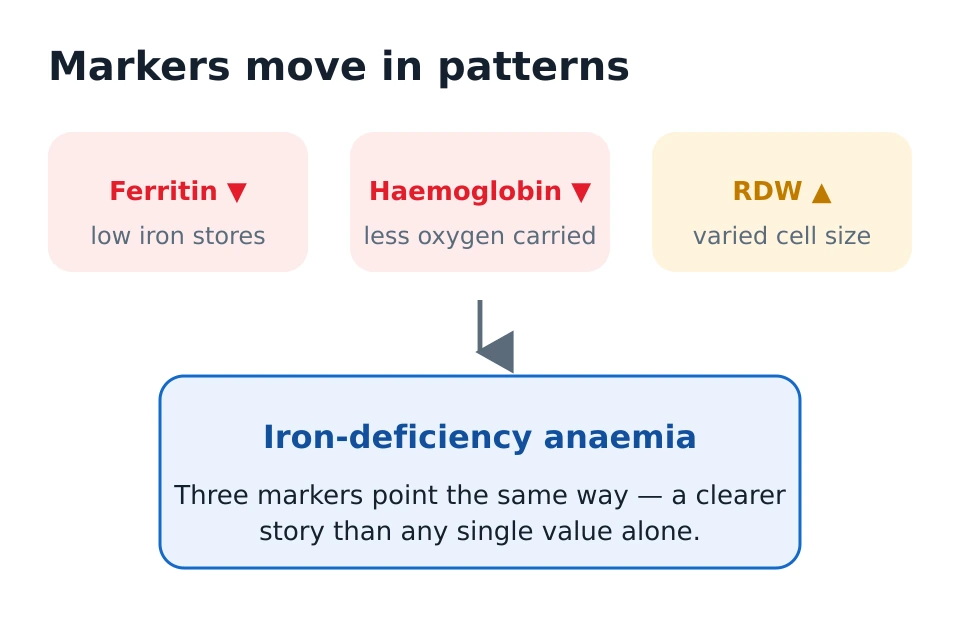
Markers move together. Low ferritin with low Hb tells a clearer story than either alone.
Turn what you found into two or three clear questions to bring to your GP or nurse.
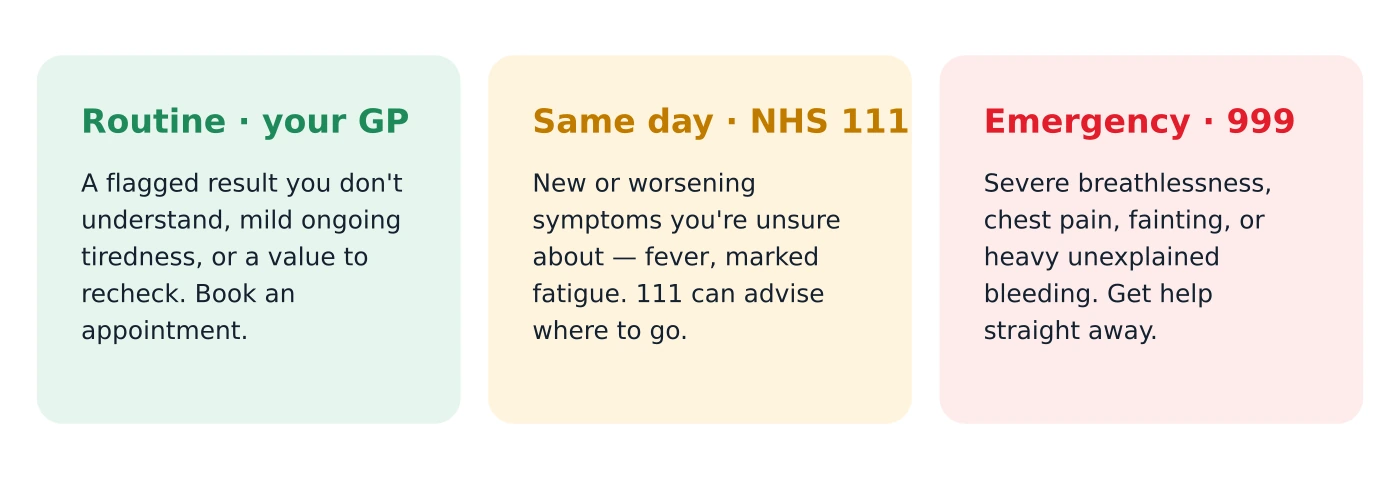
Most flagged results are followed up routinely. But some symptoms need help the same day — here's how to tell the difference.
We tested how well leading AI tools read a real FBC — for accuracy, safe framing, UK-range awareness and plain-English clarity. See the full comparison and our testing method.
Purpose-built AI blood-test analyser
Strong general explainer; needs prompting to apply UK-specific ranges consistently.
Good at context and images; can over-summarise and miss subtle flag patterns.
Careful, well-caveated explanations; conservative and less panel-specific by default.
Editorial scores from our own testing. No AI tool replaces professional medical advice.
A good analyser doesn't guess — it maps each value to the right reference range, then explains the picture in plain words.
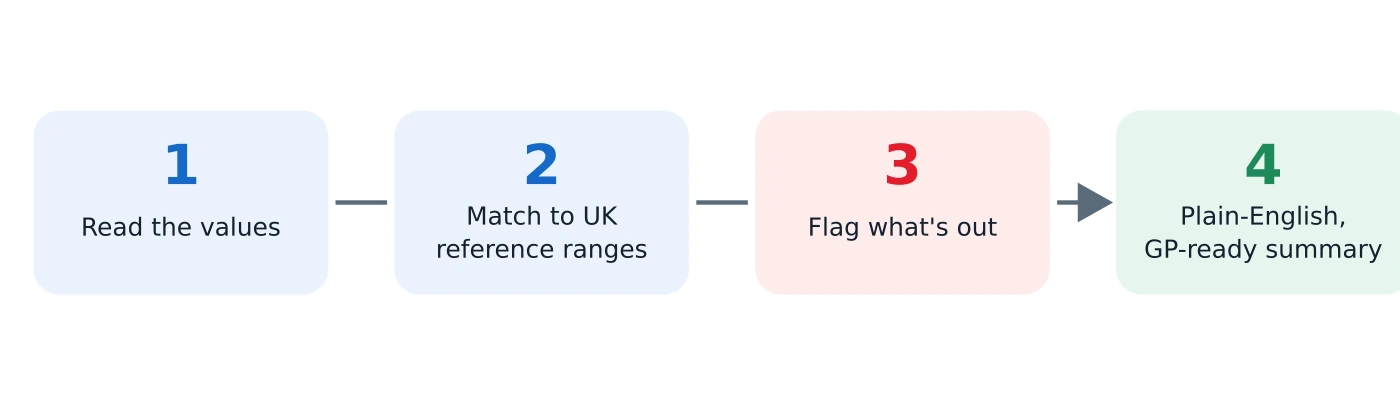
Type or upload your results and let a purpose-built analyser do the mapping. Kantesti reads the whole panel against UK ranges and hands back a calm, GP-ready summary.
Analyse my results with KantestiDeep-dive explainers on the markers people ask about most — each written and reviewed for accuracy. Browse all guides →
The plain-English starting point: columns, ranges, flags and what to do next.
Read guide PlateletsWhat high and low platelets mean, common causes, and when a result is worth acting on.
Read guide Red cellsWhy red cell distribution width matters and what a raised RDW can reveal early.
Read guide IronReading ferritin, transferrin and saturation together to understand your iron stores.
Read guide ThyroidHow TSH and free T4 work together to show an under- or overactive thyroid.
Read guide Related testsWhich markers — ferritin, thyroid, vitamin D — are worth checking when hair is thinning.
Read guideEvery guide is written in plain English and checked against authoritative UK sources. We explain, we cite, and we're clear about our limits.
Grounded in NHS, NICE, Lab Tests Online UK and MedlinePlus — with the references listed on every guide.
How we work →Each page shows when it was last reviewed, and we update as guidance changes. No fake bylines or invented experts.
About us →Information, not diagnosis. We tell you when to speak to your GP, and we never replace professional care.
Medical disclaimer →Quick answers to the questions readers ask most. For anything specific to you, your GP is the right place to go.
Upload or type them into Kantesti and get a clear, calm, UK-range-aware breakdown in seconds — then bring it to your GP.